> ## Documentation Index
> Fetch the complete documentation index at: https://nixtla-mintlify-2a3f5c2a.mintlify.site/llms.txt
> Use this file to discover all available pages before exploring further.
# Generate simulation paths for probabilistic forecasts
> Use NeuralForecast to generate correlated sample paths for scenario analysis, compare simulations with prediction intervals, and quantify future uncertainty.
> Generate correlated sample paths for scenario analysis
## Simulation vs. Prediction Intervals: When to Use Which
NeuralForecast provides two complementary approaches for reasoning about
future uncertainty:
### Prediction Intervals (`predict(level=...)`)
Prediction intervals answer: **“What range of values is the target
likely to fall within at each future time step?”**
* Output: Independent confidence bands per horizon step (e.g., 90%
interval at step $h$).
* Each step is treated marginally — no information about how steps
relate to each other.
* Best for: monitoring, alerting, dashboarding, reporting confidence
bands.
### Simulation Paths (`simulate(...)`)
Simulation paths answer: **“What are realistic *joint* future
trajectories the time series could follow?”**
* Output: $N$ complete trajectories of length $H$, each representing a
plausible future.
* Temporal correlations between steps are preserved — if step $h$ is
high, step $h+1$ is likely high too.
* Best for: scenario analysis, portfolio optimization, supply chain
planning, energy dispatch, risk assessment (VaR/CVaR), stochastic
programming.
### Key Difference: Marginal vs. Joint
Consider electricity price forecasting over 24 hours. A 90% prediction
interval tells you the price at hour 12 will likely be between \$40 and
\$80. But it says nothing about whether hours 11, 12, and 13 will *all*
be high simultaneously (a sustained price spike) or whether high and low
values alternate randomly.
Simulation paths capture this joint structure. From 500 simulated paths
you can compute: - **P(total cost > budget)** — requires summing across
correlated hours - **P(at least 3 consecutive hours above \$70)** —
requires temporal ordering - **Expected shortfall (CVaR)** — requires
the joint tail distribution
These questions *cannot* be answered from marginal prediction intervals
alone.
## Available Simulation Methods
| Method | Temporal Correlation | Description |
| --------------------------- | -------------------------------- | ------------------------------------------------------------------------------------------------------------------------------------------------------------ |
| `gaussian_copula` (default) | AR(1) Gaussian copula | Draws correlated uniform samples via Cholesky decomposition, maps through marginal CDFs. Parametric correlation structure. |
| `schaake_shuffle` | Empirical (historical templates) | Draws independent marginal samples, reorders them to match rank structure of historical trajectory templates. Nonparametric — captures arbitrary dependence. |
**Compatible losses**: - **`DistributionLoss`** (Normal, StudentT,
Poisson, etc.) and **mixture losses** (`GMM`, `PMM`, `NBMM`) — produce
arbitrary quantiles natively. - **`MQLoss`** / **`HuberMQLoss`** — uses
the model’s trained quantile grid. - **`IQLoss`** / **`HuberIQLoss`** —
evaluates multiple quantiles via repeated forward passes. - **Point
losses** (`MAE`, `MSE`, etc.) — requires `prediction_intervals`
(Conformal Prediction) set during `fit()` to build a quantile grid from
calibration scores.
## 1. Setup
```python theme={null}
import logging
import warnings
import matplotlib.pyplot as plt
import numpy as np
import pandas as pd
import torch
warnings.filterwarnings("ignore")
logging.getLogger("pytorch_lightning").setLevel(logging.ERROR)
torch.set_float32_matmul_precision("high")
```
## 2. Load Data
We use the AirPassengers dataset — a classic monthly time series of
airline passenger counts.
```python theme={null}
from neuralforecast.utils import AirPassengersDF
Y_df = AirPassengersDF.copy()
Y_train_df = Y_df[Y_df.ds <= "1959-12-31"] # 132 months train
Y_test_df = Y_df[Y_df.ds > "1959-12-31"] # 12 months test
print(f"Train: {len(Y_train_df)} rows, Test: {len(Y_test_df)} rows")
Y_train_df.tail()
```
```text theme={null}
2026-07-28 21:22:50,689 INFO util.py:154 -- Missing packages: ['ipywidgets']. Run `pip install -U ipywidgets`, then restart the notebook server for rich notebook output.
2026-07-28 21:22:50,793 INFO util.py:154 -- Missing packages: ['ipywidgets']. Run `pip install -U ipywidgets`, then restart the notebook server for rich notebook output.
```
```text theme={null}
Train: 132 rows, Test: 12 rows
```
| | unique\_id | ds | y |
| --- | ---------- | ---------- | ----- |
| 127 | 1.0 | 1959-08-31 | 559.0 |
| 128 | 1.0 | 1959-09-30 | 463.0 |
| 129 | 1.0 | 1959-10-31 | 407.0 |
| 130 | 1.0 | 1959-11-30 | 362.0 |
| 131 | 1.0 | 1959-12-31 | 405.0 |
## 3. Train Models
We train five models showcasing different loss types: - **NHITS + GMM**
— Gaussian Mixture Model, a mixture `DistributionLoss`. - **NHITS +
DistributionLoss(Normal)** — parametric distribution output. - **NHITS +
MQLoss** — Multi-Quantile Loss, directly optimizes quantile levels. -
**NHITS + IQLoss** — Implicit Quantile Loss, can evaluate any quantile
at inference. - **NHITS + MAE** with Conformal Prediction — point-loss
model with calibrated prediction intervals.
Since the MAE model needs conformal prediction intervals, we pass
`prediction_intervals` to `fit()`.
```python theme={null}
from neuralforecast import NeuralForecast
from neuralforecast.losses.pytorch import GMM, MAE, MQLoss, DistributionLoss, IQLoss
from neuralforecast.models import NHITS
from neuralforecast.utils import PredictionIntervals
H = 12
MAX_STEPS = 100
models = [
NHITS(h=H, input_size=36, max_steps=MAX_STEPS, loss=GMM(), alias="NHITS_GMM", scaler_type="robust"),
NHITS(h=H, input_size=36, max_steps=MAX_STEPS, loss=DistributionLoss(distribution="Normal"), alias="NHITS_Normal", scaler_type="robust"),
NHITS(h=H, input_size=36, max_steps=MAX_STEPS, loss=MQLoss(level=[80, 90]), alias="NHITS_MQ", scaler_type="robust"),
NHITS(h=H, input_size=36, max_steps=MAX_STEPS, loss=IQLoss(), alias="NHITS_IQL", scaler_type="robust"),
NHITS(h=H, input_size=36, max_steps=MAX_STEPS, loss=MAE(), alias="NHITS_MAE", scaler_type="robust"),
]
nf = NeuralForecast(models=models, freq="MS")
nf.fit(
df=Y_train_df,
prediction_intervals=PredictionIntervals(n_windows=2, method="conformal_error"),
)
```
## 4. Prediction Intervals (Baseline)
First, let’s see the standard prediction intervals — these are marginal
(per-step) uncertainty bands.
```python theme={null}
from utilsforecast.plotting import plot_series
fcst_df = nf.predict(level=[80, 90])
```
```python theme={null}
plot_series(Y_train_df, fcst_df, level=[80, 90], models=["NHITS_Normal"])
```
 The shaded bands show the 80% and 90% prediction intervals. These are
useful for understanding per-step uncertainty, but they do not capture
the **temporal correlation** between forecast steps. Each band is
computed independently.
## 5. Simulation Paths
Now let’s generate correlated simulation paths using the `simulate()`
method. This returns a long-format DataFrame with columns
`[unique_id, ds, sample_id, model_1, model_2, ...]`.
### Plotting helper
```python theme={null}
def extract_sims(sim_df, model_col, uid=None):
"""Extract simulation paths as a (n_paths, H) numpy array from simulate() output."""
if uid is None:
uid = sim_df["unique_id"].iloc[0]
series = sim_df[sim_df["unique_id"] == uid]
return series.pivot(index="sample_id", columns="ds", values=model_col).values
def plot_simulations(train_df, sims, model_name, title, color="steelblue", n_show=100):
"""Plot historical data with simulated future paths and derived prediction intervals."""
fig, ax = plt.subplots(1, 1, figsize=(10, 4))
# History (last 48 months)
hist = train_df.sort_values("ds").tail(48)
ax.plot(hist["ds"], hist["y"], color="black", linewidth=1.5, label="History")
# Future dates
last_date = hist["ds"].iloc[-1]
future_dates = pd.date_range(start=last_date, periods=sims.shape[1] + 1, freq="MS")[1:]
# Individual paths
for i in range(min(n_show, sims.shape[0])):
ax.plot(future_dates, sims[i], color=color, alpha=0.05, linewidth=0.5)
# Derived prediction intervals from simulations
for q_lo, q_hi, alpha in [(0.05, 0.95, 0.15), (0.10, 0.90, 0.25), (0.25, 0.75, 0.35)]:
lo = np.quantile(sims, q_lo, axis=0)
hi = np.quantile(sims, q_hi, axis=0)
ax.fill_between(future_dates, lo, hi, color=color, alpha=alpha,
label=f"{int((q_hi - q_lo) * 100)}% PI")
# Median
median = np.median(sims, axis=0)
ax.plot(future_dates, median, color=color, linewidth=2, label="Median")
# Actual (if available)
ax.plot(Y_test_df["ds"], Y_test_df["y"], color="black", linestyle="--", label="Actual")
ax.set_title(f"{title} — {model_name}")
ax.legend(loc="upper left", fontsize=8)
ax.set_xlabel("Date")
ax.set_ylabel("Passengers")
plt.tight_layout()
plt.show()
```
### Generate simulation paths
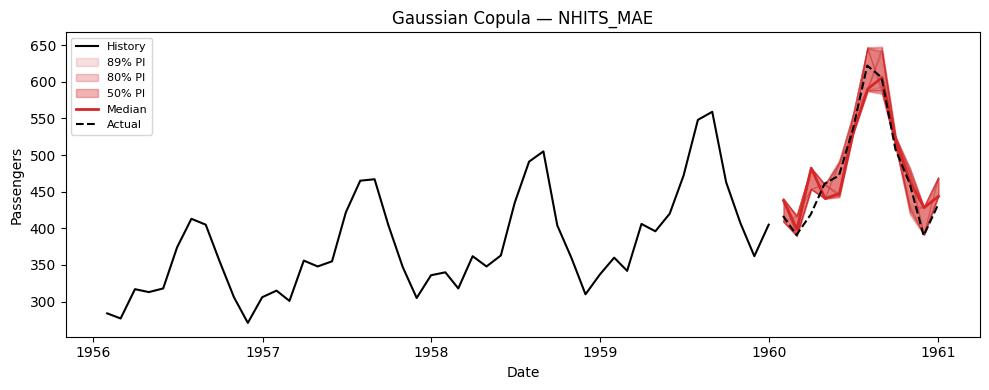
`simulate()` generates `n_paths` correlated sample paths for every model
× series combination.
```python theme={null}
N_PATHS = 500
SEED = 42
sim_df = nf.simulate(n_paths=N_PATHS, seed=SEED)
```
```python theme={null}
sim_df.head(10)
```
| | unique\_id | ds | sample\_id | NHITS\_GMM | NHITS\_Normal | NHITS\_MQ | NHITS\_IQL | NHITS\_MAE |
| - | ---------- | ---------- | ---------- | ---------- | ------------- | ---------- | ---------- | ---------- |
| 0 | 1.0 | 1960-01-01 | 0 | 424.577554 | 424.765725 | 415.206802 | 409.314326 | 438.886536 |
| 1 | 1.0 | 1960-02-01 | 0 | 404.827416 | 404.260575 | 414.203816 | 388.755800 | 416.497571 |
| 2 | 1.0 | 1960-03-01 | 0 | 469.169496 | 469.978479 | 464.367880 | 466.584492 | 482.319912 |
| 3 | 1.0 | 1960-04-01 | 0 | 450.245014 | 451.145057 | 454.416200 | 462.261105 | 459.493987 |
| 4 | 1.0 | 1960-05-01 | 0 | 472.641135 | 471.130120 | 475.350769 | 486.486899 | 493.030374 |
| 5 | 1.0 | 1960-06-01 | 0 | 528.117486 | 527.280406 | 539.266724 | 497.874372 | 530.030655 |
| 6 | 1.0 | 1960-07-01 | 0 | 594.137207 | 592.315796 | 623.242188 | 507.372412 | 586.462607 |
| 7 | 1.0 | 1960-08-01 | 0 | 604.532895 | 604.907234 | 617.977478 | 531.723887 | 583.457802 |
| 8 | 1.0 | 1960-09-01 | 0 | 530.447128 | 529.882652 | 545.858480 | 566.198389 | 524.067964 |
| 9 | 1.0 | 1960-10-01 | 0 | 458.686895 | 458.105852 | 466.378017 | 466.831645 | 468.689723 |
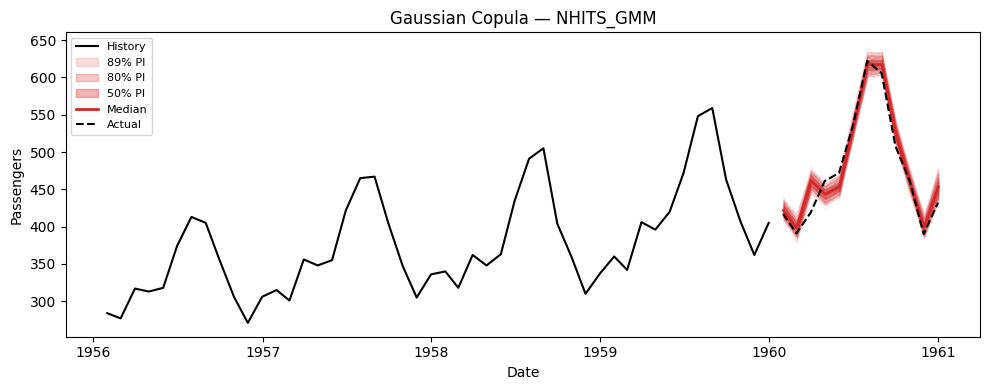
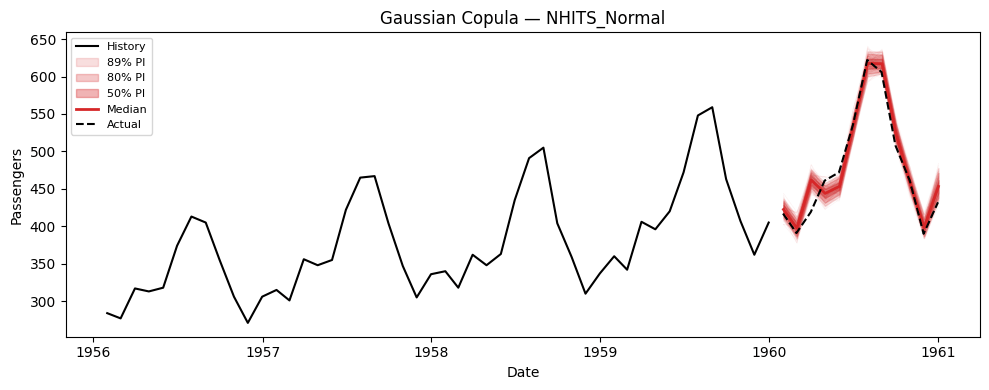
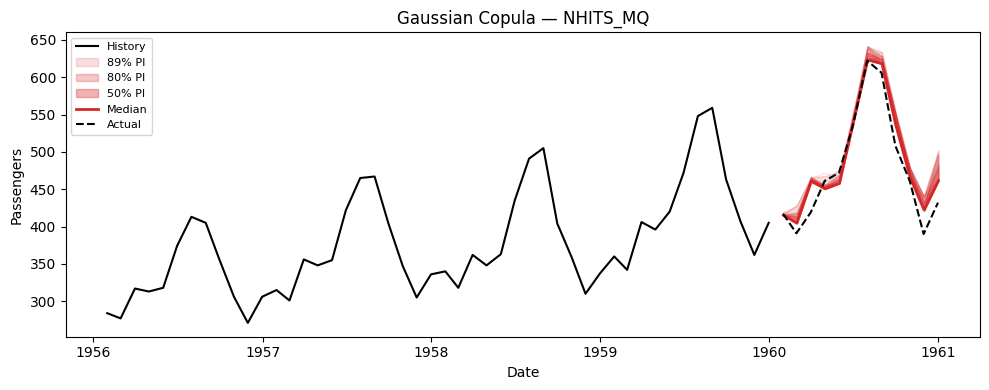
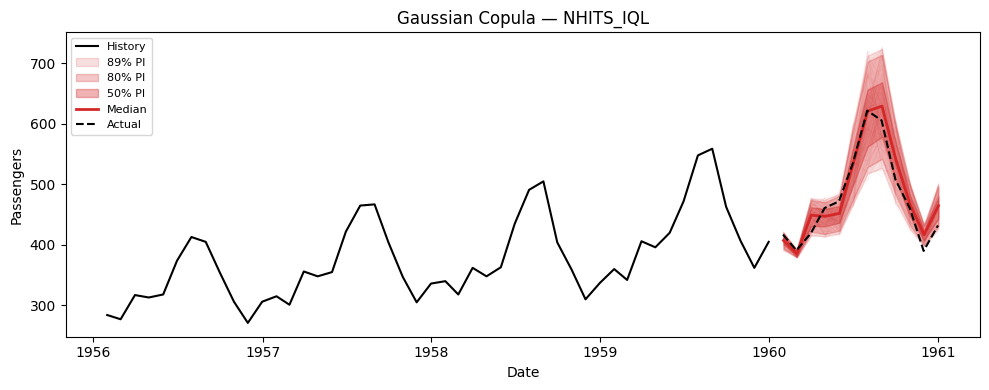
### Visualize paths for each model
```python theme={null}
# Extract (n_paths, H) arrays for plotting
model_cols = [c for c in sim_df.columns if c not in ("unique_id", "ds", "sample_id")]
for model_col in model_cols:
sims = extract_sims(sim_df, model_col)
print(f"{model_col}: simulation paths shape = {sims.shape}")
plot_simulations(Y_train_df, sims, model_col, "Gaussian Copula", color="tab:red")
```
```text theme={null}
NHITS_GMM: simulation paths shape = (500, 12)
NHITS_Normal: simulation paths shape = (500, 12)
NHITS_MQ: simulation paths shape = (500, 12)
NHITS_IQL: simulation paths shape = (500, 12)
NHITS_MAE: simulation paths shape = (500, 12)
```
The shaded bands show the 80% and 90% prediction intervals. These are
useful for understanding per-step uncertainty, but they do not capture
the **temporal correlation** between forecast steps. Each band is
computed independently.
## 5. Simulation Paths
Now let’s generate correlated simulation paths using the `simulate()`
method. This returns a long-format DataFrame with columns
`[unique_id, ds, sample_id, model_1, model_2, ...]`.
### Plotting helper
```python theme={null}
def extract_sims(sim_df, model_col, uid=None):
"""Extract simulation paths as a (n_paths, H) numpy array from simulate() output."""
if uid is None:
uid = sim_df["unique_id"].iloc[0]
series = sim_df[sim_df["unique_id"] == uid]
return series.pivot(index="sample_id", columns="ds", values=model_col).values
def plot_simulations(train_df, sims, model_name, title, color="steelblue", n_show=100):
"""Plot historical data with simulated future paths and derived prediction intervals."""
fig, ax = plt.subplots(1, 1, figsize=(10, 4))
# History (last 48 months)
hist = train_df.sort_values("ds").tail(48)
ax.plot(hist["ds"], hist["y"], color="black", linewidth=1.5, label="History")
# Future dates
last_date = hist["ds"].iloc[-1]
future_dates = pd.date_range(start=last_date, periods=sims.shape[1] + 1, freq="MS")[1:]
# Individual paths
for i in range(min(n_show, sims.shape[0])):
ax.plot(future_dates, sims[i], color=color, alpha=0.05, linewidth=0.5)
# Derived prediction intervals from simulations
for q_lo, q_hi, alpha in [(0.05, 0.95, 0.15), (0.10, 0.90, 0.25), (0.25, 0.75, 0.35)]:
lo = np.quantile(sims, q_lo, axis=0)
hi = np.quantile(sims, q_hi, axis=0)
ax.fill_between(future_dates, lo, hi, color=color, alpha=alpha,
label=f"{int((q_hi - q_lo) * 100)}% PI")
# Median
median = np.median(sims, axis=0)
ax.plot(future_dates, median, color=color, linewidth=2, label="Median")
# Actual (if available)
ax.plot(Y_test_df["ds"], Y_test_df["y"], color="black", linestyle="--", label="Actual")
ax.set_title(f"{title} — {model_name}")
ax.legend(loc="upper left", fontsize=8)
ax.set_xlabel("Date")
ax.set_ylabel("Passengers")
plt.tight_layout()
plt.show()
```
### Generate simulation paths
`simulate()` generates `n_paths` correlated sample paths for every model
× series combination.
```python theme={null}
N_PATHS = 500
SEED = 42
sim_df = nf.simulate(n_paths=N_PATHS, seed=SEED)
```
```python theme={null}
sim_df.head(10)
```
| | unique\_id | ds | sample\_id | NHITS\_GMM | NHITS\_Normal | NHITS\_MQ | NHITS\_IQL | NHITS\_MAE |
| - | ---------- | ---------- | ---------- | ---------- | ------------- | ---------- | ---------- | ---------- |
| 0 | 1.0 | 1960-01-01 | 0 | 424.577554 | 424.765725 | 415.206802 | 409.314326 | 438.886536 |
| 1 | 1.0 | 1960-02-01 | 0 | 404.827416 | 404.260575 | 414.203816 | 388.755800 | 416.497571 |
| 2 | 1.0 | 1960-03-01 | 0 | 469.169496 | 469.978479 | 464.367880 | 466.584492 | 482.319912 |
| 3 | 1.0 | 1960-04-01 | 0 | 450.245014 | 451.145057 | 454.416200 | 462.261105 | 459.493987 |
| 4 | 1.0 | 1960-05-01 | 0 | 472.641135 | 471.130120 | 475.350769 | 486.486899 | 493.030374 |
| 5 | 1.0 | 1960-06-01 | 0 | 528.117486 | 527.280406 | 539.266724 | 497.874372 | 530.030655 |
| 6 | 1.0 | 1960-07-01 | 0 | 594.137207 | 592.315796 | 623.242188 | 507.372412 | 586.462607 |
| 7 | 1.0 | 1960-08-01 | 0 | 604.532895 | 604.907234 | 617.977478 | 531.723887 | 583.457802 |
| 8 | 1.0 | 1960-09-01 | 0 | 530.447128 | 529.882652 | 545.858480 | 566.198389 | 524.067964 |
| 9 | 1.0 | 1960-10-01 | 0 | 458.686895 | 458.105852 | 466.378017 | 466.831645 | 468.689723 |
### Visualize paths for each model
```python theme={null}
# Extract (n_paths, H) arrays for plotting
model_cols = [c for c in sim_df.columns if c not in ("unique_id", "ds", "sample_id")]
for model_col in model_cols:
sims = extract_sims(sim_df, model_col)
print(f"{model_col}: simulation paths shape = {sims.shape}")
plot_simulations(Y_train_df, sims, model_col, "Gaussian Copula", color="tab:red")
```
```text theme={null}
NHITS_GMM: simulation paths shape = (500, 12)
NHITS_Normal: simulation paths shape = (500, 12)
NHITS_MQ: simulation paths shape = (500, 12)
NHITS_IQL: simulation paths shape = (500, 12)
NHITS_MAE: simulation paths shape = (500, 12)
```
 ## 6. Using Simulation Paths for Decision-Making
The key advantage of simulation paths over prediction intervals is
answering **joint** probabilistic questions. Here are concrete examples.
### Example: Probability of exceeding a cumulative threshold
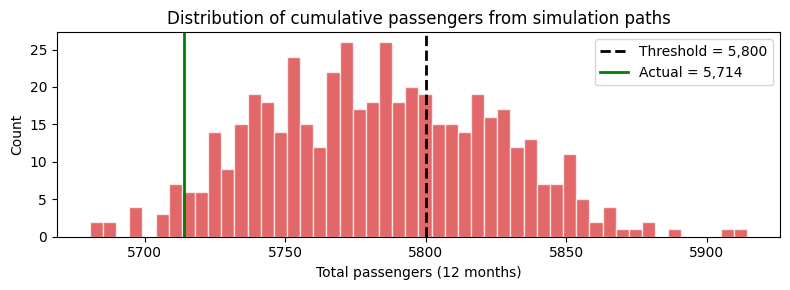
Suppose we have a capacity of 5,800 total passengers over the next 12
months. What is the probability of exceeding this capacity?
This question requires the **joint** distribution — it cannot be
answered from marginal intervals.
```python theme={null}
THRESHOLD = 5800
# Use NHITS_GMM simulations
sims_gmm = extract_sims(sim_df, "NHITS_GMM")
cumulative_passengers = sims_gmm.sum(axis=1) # Sum across H=12 months per path
prob_exceed = (cumulative_passengers > THRESHOLD).mean()
print(f"P(total passengers > {THRESHOLD:,}) = {prob_exceed:.1%}")
print(f"Expected total passengers = {cumulative_passengers.mean():,.0f}")
print(f"5th percentile = {np.quantile(cumulative_passengers, 0.05):,.0f}")
print(f"95th percentile = {np.quantile(cumulative_passengers, 0.95):,.0f}")
fig, ax = plt.subplots(figsize=(8, 3))
ax.hist(cumulative_passengers, bins=50, color="tab:red", alpha=0.7, edgecolor="white")
ax.axvline(THRESHOLD, color="black", linestyle="--", linewidth=2, label=f"Threshold = {THRESHOLD:,}")
ax.axvline(Y_test_df["y"].sum(), color="green", linestyle="-", linewidth=2, label=f"Actual = {Y_test_df['y'].sum():,.0f}")
ax.set_xlabel("Total passengers (12 months)")
ax.set_ylabel("Count")
ax.set_title("Distribution of cumulative passengers from simulation paths")
ax.legend()
plt.tight_layout()
plt.show()
```
```text theme={null}
P(total passengers > 5,800) = 35.4%
Expected total passengers = 5,783
5th percentile = 5,720
95th percentile = 5,851
```
## 6. Using Simulation Paths for Decision-Making
The key advantage of simulation paths over prediction intervals is
answering **joint** probabilistic questions. Here are concrete examples.
### Example: Probability of exceeding a cumulative threshold
Suppose we have a capacity of 5,800 total passengers over the next 12
months. What is the probability of exceeding this capacity?
This question requires the **joint** distribution — it cannot be
answered from marginal intervals.
```python theme={null}
THRESHOLD = 5800
# Use NHITS_GMM simulations
sims_gmm = extract_sims(sim_df, "NHITS_GMM")
cumulative_passengers = sims_gmm.sum(axis=1) # Sum across H=12 months per path
prob_exceed = (cumulative_passengers > THRESHOLD).mean()
print(f"P(total passengers > {THRESHOLD:,}) = {prob_exceed:.1%}")
print(f"Expected total passengers = {cumulative_passengers.mean():,.0f}")
print(f"5th percentile = {np.quantile(cumulative_passengers, 0.05):,.0f}")
print(f"95th percentile = {np.quantile(cumulative_passengers, 0.95):,.0f}")
fig, ax = plt.subplots(figsize=(8, 3))
ax.hist(cumulative_passengers, bins=50, color="tab:red", alpha=0.7, edgecolor="white")
ax.axvline(THRESHOLD, color="black", linestyle="--", linewidth=2, label=f"Threshold = {THRESHOLD:,}")
ax.axvline(Y_test_df["y"].sum(), color="green", linestyle="-", linewidth=2, label=f"Actual = {Y_test_df['y'].sum():,.0f}")
ax.set_xlabel("Total passengers (12 months)")
ax.set_ylabel("Count")
ax.set_title("Distribution of cumulative passengers from simulation paths")
ax.legend()
plt.tight_layout()
plt.show()
```
```text theme={null}
P(total passengers > 5,800) = 35.4%
Expected total passengers = 5,783
5th percentile = 5,720
95th percentile = 5,851
```
 ## 7. Comparing Simulation Methods: Gaussian Copula vs. Schaake Shuffle
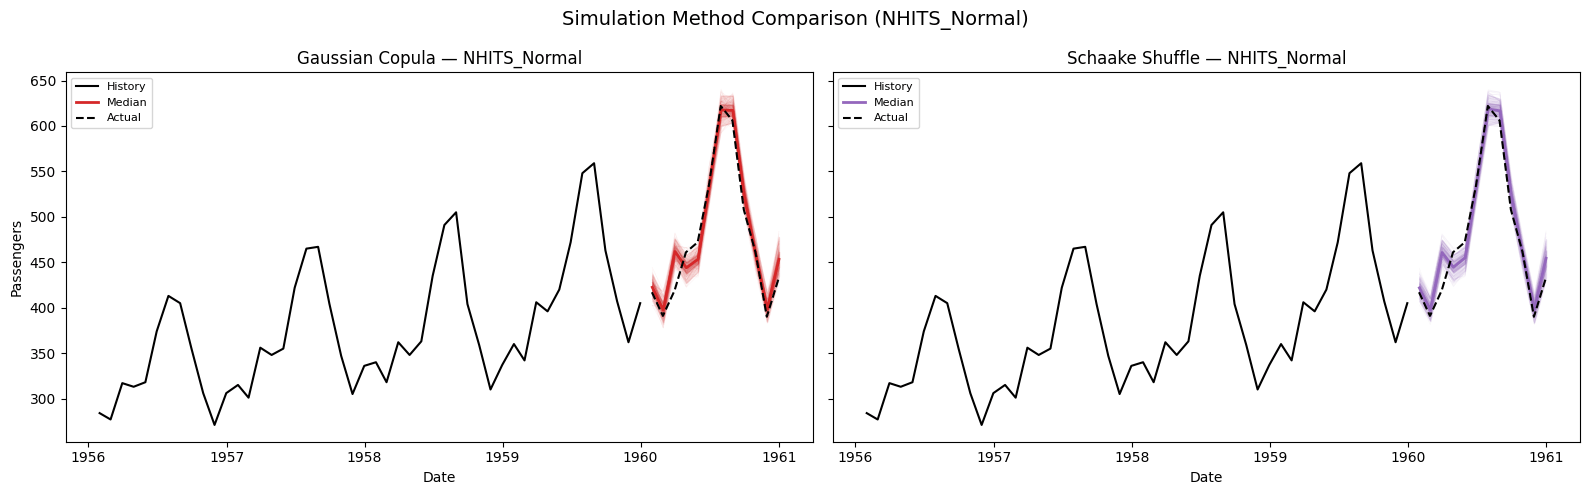
Both methods use the same marginal quantile forecasts but differ in how
they introduce temporal correlation across horizon steps. Let’s compare
them on the **NHITS\_Normal** model.
```python theme={null}
# Generate paths with both methods
sim_copula = nf.simulate(n_paths=N_PATHS, seed=SEED, method="gaussian_copula")
sim_schaake = nf.simulate(n_paths=N_PATHS, seed=SEED, method="schaake_shuffle")
```
```python theme={null}
sims_copula = extract_sims(sim_copula, "NHITS_Normal")
sims_schaake = extract_sims(sim_schaake, "NHITS_Normal")
# Side-by-side path comparison
fig, axes = plt.subplots(1, 2, figsize=(16, 5), sharey=True)
hist = Y_train_df.sort_values("ds").tail(48)
last_date = hist["ds"].iloc[-1]
future_dates = pd.date_range(start=last_date, periods=H + 1, freq="MS")[1:]
for ax, sims, title, color in zip(
axes,
[sims_copula, sims_schaake],
["Gaussian Copula", "Schaake Shuffle"],
["tab:red", "tab:purple"],
):
ax.plot(hist["ds"], hist["y"], color="black", linewidth=1.5, label="History")
for i in range(min(100, sims.shape[0])):
ax.plot(future_dates, sims[i], color=color, alpha=0.05, linewidth=0.5)
for q_lo, q_hi, alpha in [(0.05, 0.95, 0.15), (0.25, 0.75, 0.30)]:
lo = np.quantile(sims, q_lo, axis=0)
hi = np.quantile(sims, q_hi, axis=0)
ax.fill_between(future_dates, lo, hi, color=color, alpha=alpha)
median = np.median(sims, axis=0)
ax.plot(future_dates, median, color=color, linewidth=2, label="Median")
ax.plot(Y_test_df["ds"], Y_test_df["y"], color="black", linestyle="--", label="Actual")
ax.set_title(f"{title} — NHITS_Normal")
ax.set_xlabel("Date")
ax.legend(loc="upper left", fontsize=8)
axes[0].set_ylabel("Passengers")
plt.suptitle("Simulation Method Comparison (NHITS_Normal)", fontsize=14)
plt.tight_layout()
plt.show()
```
## 7. Comparing Simulation Methods: Gaussian Copula vs. Schaake Shuffle
Both methods use the same marginal quantile forecasts but differ in how
they introduce temporal correlation across horizon steps. Let’s compare
them on the **NHITS\_Normal** model.
```python theme={null}
# Generate paths with both methods
sim_copula = nf.simulate(n_paths=N_PATHS, seed=SEED, method="gaussian_copula")
sim_schaake = nf.simulate(n_paths=N_PATHS, seed=SEED, method="schaake_shuffle")
```
```python theme={null}
sims_copula = extract_sims(sim_copula, "NHITS_Normal")
sims_schaake = extract_sims(sim_schaake, "NHITS_Normal")
# Side-by-side path comparison
fig, axes = plt.subplots(1, 2, figsize=(16, 5), sharey=True)
hist = Y_train_df.sort_values("ds").tail(48)
last_date = hist["ds"].iloc[-1]
future_dates = pd.date_range(start=last_date, periods=H + 1, freq="MS")[1:]
for ax, sims, title, color in zip(
axes,
[sims_copula, sims_schaake],
["Gaussian Copula", "Schaake Shuffle"],
["tab:red", "tab:purple"],
):
ax.plot(hist["ds"], hist["y"], color="black", linewidth=1.5, label="History")
for i in range(min(100, sims.shape[0])):
ax.plot(future_dates, sims[i], color=color, alpha=0.05, linewidth=0.5)
for q_lo, q_hi, alpha in [(0.05, 0.95, 0.15), (0.25, 0.75, 0.30)]:
lo = np.quantile(sims, q_lo, axis=0)
hi = np.quantile(sims, q_hi, axis=0)
ax.fill_between(future_dates, lo, hi, color=color, alpha=alpha)
median = np.median(sims, axis=0)
ax.plot(future_dates, median, color=color, linewidth=2, label="Median")
ax.plot(Y_test_df["ds"], Y_test_df["y"], color="black", linestyle="--", label="Actual")
ax.set_title(f"{title} — NHITS_Normal")
ax.set_xlabel("Date")
ax.legend(loc="upper left", fontsize=8)
axes[0].set_ylabel("Passengers")
plt.suptitle("Simulation Method Comparison (NHITS_Normal)", fontsize=14)
plt.tight_layout()
plt.show()
```
 ### Diagnosing the dependence structure
The path bundles above look nearly identical, and they should: both
methods share the same marginal quantiles, so any per-step summary — the
median line, the shaded intervals — is by construction the same. The
methods differ only in the **joint** structure, which no marginal view
can reveal.
Two diagnostics that do reveal it: the step-to-step rank correlation of
the paths, and the mean longest run of consecutive months above their
own median. Both are compared against the same statistics on the
historical rolling windows (the Schaake shuffle’s own templates) and
against a null built by permuting each step independently — identical
marginals, dependence destroyed.
```python theme={null}
def lag1_rank_corr(paths):
"""Mean lag-1 Spearman correlation across consecutive horizon steps."""
ranks = np.apply_along_axis(lambda c: np.argsort(np.argsort(c)), 0, paths)
return np.mean([
np.corrcoef(ranks[:, h], ranks[:, h + 1])[0, 1]
for h in range(paths.shape[1] - 1)
])
def mean_longest_run(paths):
"""Mean longest run of consecutive months above that month's median."""
above = paths > np.median(paths, axis=0)
runs = []
for row in above:
best = current = 0
for flag in row:
current = current + 1 if flag else 0
best = max(best, current)
runs.append(best)
return np.mean(runs)
def break_dependence(paths, seed=0):
"""Permute each step independently: same marginals, no temporal structure."""
rng = np.random.default_rng(seed)
return np.column_stack([rng.permutation(paths[:, h]) for h in range(paths.shape[1])])
# Reference: the same statistics on the history's length-H rolling windows, which is
# exactly what the Schaake shuffle uses as its templates.
hist_windows = np.lib.stride_tricks.sliding_window_view(
Y_train_df["y"].to_numpy(), H
)
rows = [
("History (rolling windows)", hist_windows),
("Gaussian copula", sims_copula),
("Schaake shuffle", sims_schaake),
("Schaake, dependence broken", break_dependence(sims_schaake)),
]
print(f"{'':28s}{'lag-1 rank corr':>17s}{'mean longest run':>19s}")
for name, paths in rows:
print(f"{name:28s}{lag1_rank_corr(paths):>+17.3f}{mean_longest_run(paths):>19.2f}")
```
```text theme={null}
lag-1 rank corr mean longest run
History (rolling windows) +0.962 5.51
Gaussian copula +0.267 3.49
Schaake shuffle +0.963 5.60
Schaake, dependence broken -0.006 3.04
```
## 8. Evaluating Marginal vs. Joint Distributions
We can evaluate both the **marginal** distribution (from
`predict(quantiles=...)`) and the **joint** distribution (from
`simulate()`) using the same metrics. For each model we compare:
* **Point metrics**: MAE, MSE on the median forecast.
* **Probabilistic metric**: scaled CRPS on the quantile forecasts —
either from `predict` (marginal) or derived from simulation paths
(joint).
If the simulation paths are well-calibrated, their empirical quantiles
should score comparably to the model’s native marginal quantiles.
```python theme={null}
from utilsforecast.evaluation import evaluate
from utilsforecast.losses import mae, mse, scaled_crps
# ── Quantile grid for evaluation ──
eval_quantiles = np.round(np.arange(0.1, 1.0, 0.1), 2).tolist() # [0.1, 0.2, ..., 0.9]
# We'll evaluate NHITS_Normal only for clarity
MODEL = "NHITS_Normal"
# ── 1. Marginal quantiles from predict() ──
marginal_df = nf.predict(quantiles=eval_quantiles)
# Add actuals — align by position (predict uses freq="MS" dates, test data has month-end dates)
marginal_df = marginal_df.sort_values(["unique_id", "ds"]).reset_index(drop=True)
marginal_df["y"] = Y_test_df.sort_values(["unique_id", "ds"])["y"].values
# ── 2. Joint quantiles derived from simulation paths (gaussian_copula) ──
sims_gc = extract_sims(sim_copula, MODEL) # (n_paths, H)
joint_gc_df = marginal_df[["unique_id", "ds", "y"]].copy()
for q in eval_quantiles:
joint_gc_df[f"{MODEL}_ql{q}"] = np.quantile(sims_gc, q, axis=0)
joint_gc_df[MODEL] = np.median(sims_gc, axis=0)
# ── 3. Joint quantiles derived from simulation paths (schaake_shuffle) ──
sims_ss = extract_sims(sim_schaake, MODEL) # (n_paths, H)
joint_ss_df = marginal_df[["unique_id", "ds", "y"]].copy()
for q in eval_quantiles:
joint_ss_df[f"{MODEL}_ql{q}"] = np.quantile(sims_ss, q, axis=0)
joint_ss_df[MODEL] = np.median(sims_ss, axis=0)
```
```python theme={null}
# ── Evaluate point metrics (via evaluate) ──
point_marginal = evaluate(marginal_df, metrics=[mae, mse], models=[MODEL], agg_fn="mean")
point_gc = evaluate(joint_gc_df, metrics=[mae, mse], models=[MODEL], agg_fn="mean")
point_ss = evaluate(joint_ss_df, metrics=[mae, mse], models=[MODEL], agg_fn="mean")
# ── Evaluate scaled CRPS (called directly — evaluate expects level-style columns) ──
quantile_cols = {MODEL: [f"{MODEL}_ql{q}" for q in eval_quantiles]}
quantiles_arr = np.array(eval_quantiles)
crps_marginal = scaled_crps(marginal_df, models=quantile_cols, quantiles=quantiles_arr)
crps_gc = scaled_crps(joint_gc_df, models=quantile_cols, quantiles=quantiles_arr)
crps_ss = scaled_crps(joint_ss_df, models=quantile_cols, quantiles=quantiles_arr)
# ── Combine results ──
results = pd.DataFrame({
"Metric": ["MAE", "MSE", "Scaled CRPS"],
"Marginal (predict)": [
point_marginal[MODEL].values[0],
point_marginal[MODEL].values[1],
crps_marginal[MODEL].mean(),
],
"Joint — Gaussian Copula": [
point_gc[MODEL].values[0],
point_gc[MODEL].values[1],
crps_gc[MODEL].mean(),
],
"Joint — Schaake Shuffle": [
point_ss[MODEL].values[0],
point_ss[MODEL].values[1],
crps_ss[MODEL].mean(),
],
}).set_index("Metric")
print(f"Model: {MODEL}")
results
```
```text theme={null}
Model: NHITS_Normal
```
| | Marginal (predict) | Joint — Gaussian Copula | Joint — Schaake Shuffle |
| ----------- | ------------------ | ----------------------- | ----------------------- |
| Metric | | | |
| MAE | 12.669576 | 12.942177 | 12.516772 |
| MSE | 276.955045 | 288.357283 | 275.653049 |
| Scaled CRPS | 0.021440 | 0.022133 | 0.021545 |
**Interpreting the results:**
* **MAE / MSE** (point metrics): Both simulation methods use the
median of the sample paths as their point forecast. Since the
marginal quantiles and simulation-derived quantiles share the same
underlying model, the median forecasts are similar but not identical
— simulation introduces sampling variability.
* **Scaled CRPS** (probabilistic metric): Measures the quality of the
full quantile distribution. The marginal quantiles come directly
from the model’s predictive distribution, while the
simulation-derived quantiles are empirical (computed from `n_paths`
samples). With enough paths, the simulation CRPS should converge to
the marginal CRPS.
## 9. Summary
| Question | Use |
| ----------------------------------------------- | ------------------------------------------- |
| “What range is step $h$ likely in?” | `predict(level=...)` — prediction intervals |
| “What are realistic joint future trajectories?” | `simulate(n_paths=...)` — sample paths |
| “What is P(total > threshold)?” | `simulate()` then sum paths |
| “What is P(3 consecutive spikes)?” | `simulate()` then check path patterns |
| “What is the CVaR of my portfolio?” | `simulate()` then compute tail statistics |
### Simulation Methods
| Method | Use when… |
| --------------------------- | ---------------------------------------------------------------------------------------------------------------- |
| `gaussian_copula` (default) | You want smooth, parametric temporal correlation (AR(1) structure). Fast and robust. |
| `schaake_shuffle` | You want nonparametric dependence from historical data. Captures asymmetric / non-Gaussian correlation patterns. |
### Compatible Losses
| Loss type | How quantiles are obtained |
| ---------------------------------------- | ------------------------------------------------------------------------------- |
| `DistributionLoss`, `GMM`, `PMM`, `NBMM` | Arbitrary quantiles from parametric distribution |
| `MQLoss` / `HuberMQLoss` | Uses the model’s trained quantile grid |
| `IQLoss` / `HuberIQLoss` | Multiple forward passes, one per quantile |
| Point losses (`MAE`, `MSE`, etc.) | Conformal Prediction intervals (requires `prediction_intervals` during `fit()`) |
### References
* Baron, E. et al. (2025). [Efficiently generating correlated sample
paths from multi-step time series foundation
models](https://arxiv.org/abs/2510.02224). NeurIPS 2025 Workshop.
* Clark, M. et al. (2004). The Schaake shuffle: A method for
reconstructing space-time variability. *Journal of
Hydrometeorology*, 5(1).
### Diagnosing the dependence structure
The path bundles above look nearly identical, and they should: both
methods share the same marginal quantiles, so any per-step summary — the
median line, the shaded intervals — is by construction the same. The
methods differ only in the **joint** structure, which no marginal view
can reveal.
Two diagnostics that do reveal it: the step-to-step rank correlation of
the paths, and the mean longest run of consecutive months above their
own median. Both are compared against the same statistics on the
historical rolling windows (the Schaake shuffle’s own templates) and
against a null built by permuting each step independently — identical
marginals, dependence destroyed.
```python theme={null}
def lag1_rank_corr(paths):
"""Mean lag-1 Spearman correlation across consecutive horizon steps."""
ranks = np.apply_along_axis(lambda c: np.argsort(np.argsort(c)), 0, paths)
return np.mean([
np.corrcoef(ranks[:, h], ranks[:, h + 1])[0, 1]
for h in range(paths.shape[1] - 1)
])
def mean_longest_run(paths):
"""Mean longest run of consecutive months above that month's median."""
above = paths > np.median(paths, axis=0)
runs = []
for row in above:
best = current = 0
for flag in row:
current = current + 1 if flag else 0
best = max(best, current)
runs.append(best)
return np.mean(runs)
def break_dependence(paths, seed=0):
"""Permute each step independently: same marginals, no temporal structure."""
rng = np.random.default_rng(seed)
return np.column_stack([rng.permutation(paths[:, h]) for h in range(paths.shape[1])])
# Reference: the same statistics on the history's length-H rolling windows, which is
# exactly what the Schaake shuffle uses as its templates.
hist_windows = np.lib.stride_tricks.sliding_window_view(
Y_train_df["y"].to_numpy(), H
)
rows = [
("History (rolling windows)", hist_windows),
("Gaussian copula", sims_copula),
("Schaake shuffle", sims_schaake),
("Schaake, dependence broken", break_dependence(sims_schaake)),
]
print(f"{'':28s}{'lag-1 rank corr':>17s}{'mean longest run':>19s}")
for name, paths in rows:
print(f"{name:28s}{lag1_rank_corr(paths):>+17.3f}{mean_longest_run(paths):>19.2f}")
```
```text theme={null}
lag-1 rank corr mean longest run
History (rolling windows) +0.962 5.51
Gaussian copula +0.267 3.49
Schaake shuffle +0.963 5.60
Schaake, dependence broken -0.006 3.04
```
## 8. Evaluating Marginal vs. Joint Distributions
We can evaluate both the **marginal** distribution (from
`predict(quantiles=...)`) and the **joint** distribution (from
`simulate()`) using the same metrics. For each model we compare:
* **Point metrics**: MAE, MSE on the median forecast.
* **Probabilistic metric**: scaled CRPS on the quantile forecasts —
either from `predict` (marginal) or derived from simulation paths
(joint).
If the simulation paths are well-calibrated, their empirical quantiles
should score comparably to the model’s native marginal quantiles.
```python theme={null}
from utilsforecast.evaluation import evaluate
from utilsforecast.losses import mae, mse, scaled_crps
# ── Quantile grid for evaluation ──
eval_quantiles = np.round(np.arange(0.1, 1.0, 0.1), 2).tolist() # [0.1, 0.2, ..., 0.9]
# We'll evaluate NHITS_Normal only for clarity
MODEL = "NHITS_Normal"
# ── 1. Marginal quantiles from predict() ──
marginal_df = nf.predict(quantiles=eval_quantiles)
# Add actuals — align by position (predict uses freq="MS" dates, test data has month-end dates)
marginal_df = marginal_df.sort_values(["unique_id", "ds"]).reset_index(drop=True)
marginal_df["y"] = Y_test_df.sort_values(["unique_id", "ds"])["y"].values
# ── 2. Joint quantiles derived from simulation paths (gaussian_copula) ──
sims_gc = extract_sims(sim_copula, MODEL) # (n_paths, H)
joint_gc_df = marginal_df[["unique_id", "ds", "y"]].copy()
for q in eval_quantiles:
joint_gc_df[f"{MODEL}_ql{q}"] = np.quantile(sims_gc, q, axis=0)
joint_gc_df[MODEL] = np.median(sims_gc, axis=0)
# ── 3. Joint quantiles derived from simulation paths (schaake_shuffle) ──
sims_ss = extract_sims(sim_schaake, MODEL) # (n_paths, H)
joint_ss_df = marginal_df[["unique_id", "ds", "y"]].copy()
for q in eval_quantiles:
joint_ss_df[f"{MODEL}_ql{q}"] = np.quantile(sims_ss, q, axis=0)
joint_ss_df[MODEL] = np.median(sims_ss, axis=0)
```
```python theme={null}
# ── Evaluate point metrics (via evaluate) ──
point_marginal = evaluate(marginal_df, metrics=[mae, mse], models=[MODEL], agg_fn="mean")
point_gc = evaluate(joint_gc_df, metrics=[mae, mse], models=[MODEL], agg_fn="mean")
point_ss = evaluate(joint_ss_df, metrics=[mae, mse], models=[MODEL], agg_fn="mean")
# ── Evaluate scaled CRPS (called directly — evaluate expects level-style columns) ──
quantile_cols = {MODEL: [f"{MODEL}_ql{q}" for q in eval_quantiles]}
quantiles_arr = np.array(eval_quantiles)
crps_marginal = scaled_crps(marginal_df, models=quantile_cols, quantiles=quantiles_arr)
crps_gc = scaled_crps(joint_gc_df, models=quantile_cols, quantiles=quantiles_arr)
crps_ss = scaled_crps(joint_ss_df, models=quantile_cols, quantiles=quantiles_arr)
# ── Combine results ──
results = pd.DataFrame({
"Metric": ["MAE", "MSE", "Scaled CRPS"],
"Marginal (predict)": [
point_marginal[MODEL].values[0],
point_marginal[MODEL].values[1],
crps_marginal[MODEL].mean(),
],
"Joint — Gaussian Copula": [
point_gc[MODEL].values[0],
point_gc[MODEL].values[1],
crps_gc[MODEL].mean(),
],
"Joint — Schaake Shuffle": [
point_ss[MODEL].values[0],
point_ss[MODEL].values[1],
crps_ss[MODEL].mean(),
],
}).set_index("Metric")
print(f"Model: {MODEL}")
results
```
```text theme={null}
Model: NHITS_Normal
```
| | Marginal (predict) | Joint — Gaussian Copula | Joint — Schaake Shuffle |
| ----------- | ------------------ | ----------------------- | ----------------------- |
| Metric | | | |
| MAE | 12.669576 | 12.942177 | 12.516772 |
| MSE | 276.955045 | 288.357283 | 275.653049 |
| Scaled CRPS | 0.021440 | 0.022133 | 0.021545 |
**Interpreting the results:**
* **MAE / MSE** (point metrics): Both simulation methods use the
median of the sample paths as their point forecast. Since the
marginal quantiles and simulation-derived quantiles share the same
underlying model, the median forecasts are similar but not identical
— simulation introduces sampling variability.
* **Scaled CRPS** (probabilistic metric): Measures the quality of the
full quantile distribution. The marginal quantiles come directly
from the model’s predictive distribution, while the
simulation-derived quantiles are empirical (computed from `n_paths`
samples). With enough paths, the simulation CRPS should converge to
the marginal CRPS.
## 9. Summary
| Question | Use |
| ----------------------------------------------- | ------------------------------------------- |
| “What range is step $h$ likely in?” | `predict(level=...)` — prediction intervals |
| “What are realistic joint future trajectories?” | `simulate(n_paths=...)` — sample paths |
| “What is P(total > threshold)?” | `simulate()` then sum paths |
| “What is P(3 consecutive spikes)?” | `simulate()` then check path patterns |
| “What is the CVaR of my portfolio?” | `simulate()` then compute tail statistics |
### Simulation Methods
| Method | Use when… |
| --------------------------- | ---------------------------------------------------------------------------------------------------------------- |
| `gaussian_copula` (default) | You want smooth, parametric temporal correlation (AR(1) structure). Fast and robust. |
| `schaake_shuffle` | You want nonparametric dependence from historical data. Captures asymmetric / non-Gaussian correlation patterns. |
### Compatible Losses
| Loss type | How quantiles are obtained |
| ---------------------------------------- | ------------------------------------------------------------------------------- |
| `DistributionLoss`, `GMM`, `PMM`, `NBMM` | Arbitrary quantiles from parametric distribution |
| `MQLoss` / `HuberMQLoss` | Uses the model’s trained quantile grid |
| `IQLoss` / `HuberIQLoss` | Multiple forward passes, one per quantile |
| Point losses (`MAE`, `MSE`, etc.) | Conformal Prediction intervals (requires `prediction_intervals` during `fit()`) |
### References
* Baron, E. et al. (2025). [Efficiently generating correlated sample
paths from multi-step time series foundation
models](https://arxiv.org/abs/2510.02224). NeurIPS 2025 Workshop.
* Clark, M. et al. (2004). The Schaake shuffle: A method for
reconstructing space-time variability. *Journal of
Hydrometeorology*, 5(1).